
US and European climate agencies say 2023 was the hottest year on record and that they are observing a global warming trend. Online claims that record temperatures in 1997 contradict this are misleading; they compare an old dataset from the US National Oceanic and Atmospheric Administration (NOAA) with more recent findings from the European Union’s Copernicus — which does not use the same measuring stations or technology.
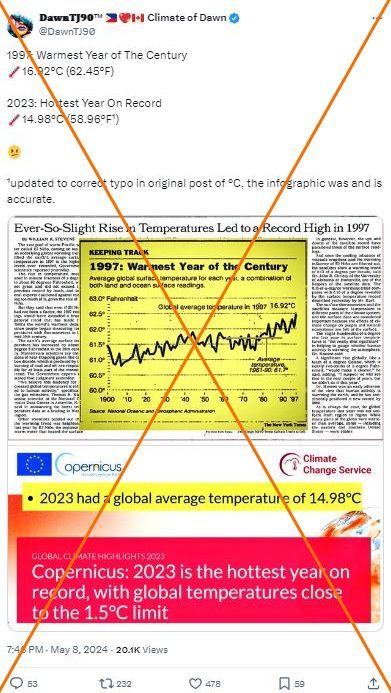
“1997: Warmest Year of The Century 16.92°C (62.45°F) 2023: Hottest Year On Record 14.98°C (58.96°C),” says a May 8, 2024 post on X.
The post shares screenshots of an old New York Times article (archived here) about weather data that NOAA collected in 1997, as well as a genuine Copernicus report on 2023’s record temperatures (archived here).
Posts sharing the same visual have circulated elsewhere on social media, including in French and Italian.
The posts are part of a trend of claims seeking to downplay the role of human-caused climate change in record heat. But both Copernicus and NOAA reported in early 2024 that the preceding year was the hottest on record (archived here and here).
The agencies said the increase in Earth’s surface temperature nearly crossed the critical threshold of 1.5 degrees Celsius, beyond which climate impacts are more likely to become self-reinforcing and catastrophic.
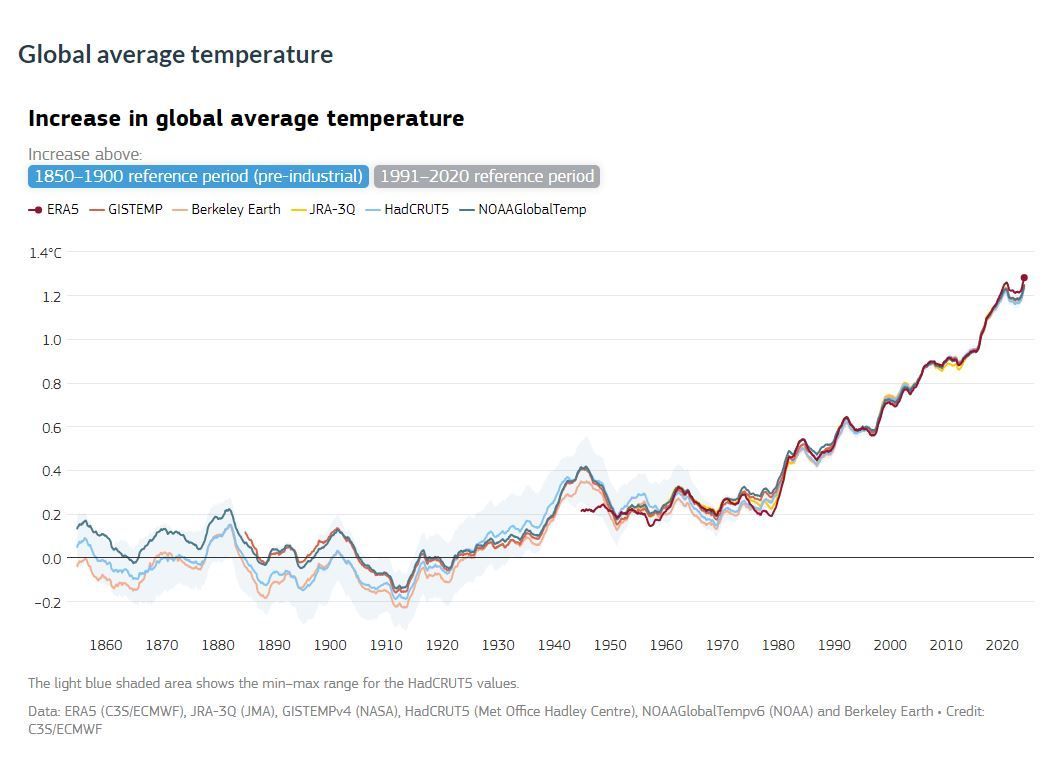
An analysis of six widely cited datasets (archived here) — including those from Copernicus and NOAA — also shows matching warming trends across agencies.
‘Comparing apples and oranges’
Karin Gleason, a scientist at NOAA’s National Centers for Environmental Information (archived here), said it is no surprise that NOAA data do not exactly match Copernicus data, as they are different measurement systems. However, she said the “overall patterns will be very similar.”
Copernicus data do not go as far back in time due to its reliance on satellites and other more modern measurement systems. But Zeke Hausfather, a climate scientist and energy systems analyst (archived here), said its dataset is still “quite good at calculating absolute temperatures as well as changes over time.”
“When we scientists want to study the Earth’s absolute temperatures, we’d look at data from Copernicus,” he said May 9.
Alternatively, he said NOAA examines surface temperature “where we have measurements from weather stations, buoys, ship measurements, etc.” Scientists then use the changes in temperature over space and time to fill in the gaps.
“Knowing the change over the course of months and years in one area gives you a pretty good estimate of the change in nearby areas,” Hausfather said.
Each dataset serves different purposes, and “comparing NOAA and Copernicus absolute temperature estimates is comparing apples to oranges,” he said.
NASA scientist Gavin Schmidt (archived here) agreed.
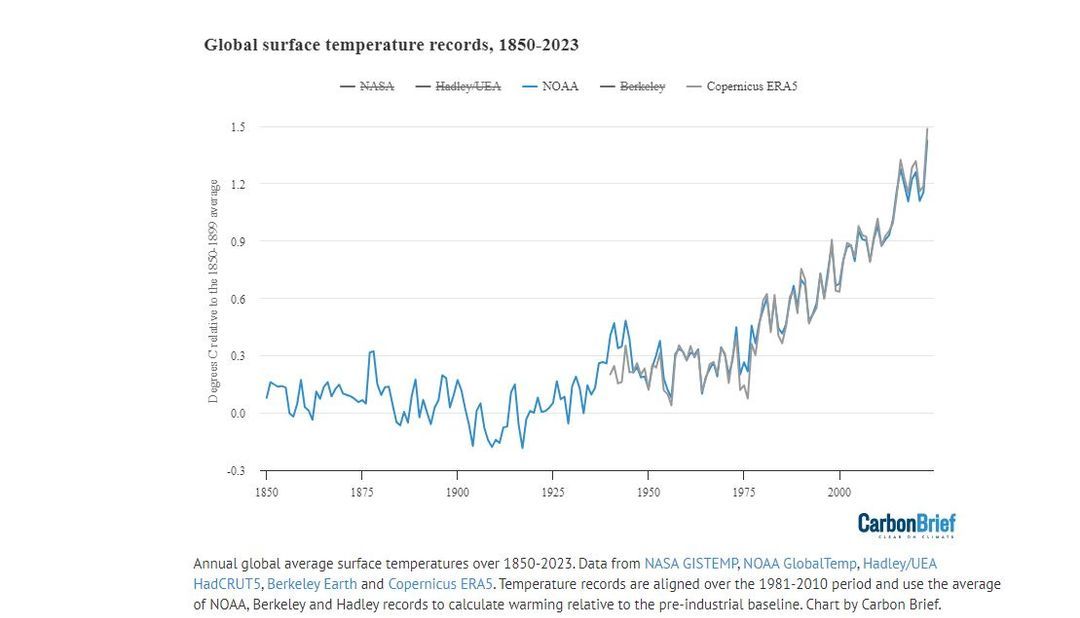
He told AFP on May 29 that while NOAA and Copernicus data are different, “they are highly consistent and tell the same story.” Data compiled by the environmental nonprofit Carbon Brief bear that out (archived here).
New NOAA analysis
The screenshot shared online shows genuine NOAA figures reported in 1998 (archived here), but it does not take into account a reanalysis using updated techniques that integrated temperature anomalies (archived here).
According to that more recent analysis, “1997 has a +0.49ºC anomaly value (so 13.9ºC + 0.49ºC = 14.39ºC) compared with the 2023 anomaly value of +1.19ºC (13.9ºC + 1.19ºC = 15.09ºC),” NOAA’s Gleason told AFP on May 28.
“Clearly, 2023 is warmer than 1997 when comparing data from the same dataset.”
NOAA says on its website that a temperature anomaly is a “departure from a reference value or long-term average” (archived here). The agency says “absolute estimates of global average surface temperature are difficult,” and that measuring anomalies more accurately describes climate variability.
“For example, a summer month over an area may be cooler than average, both at a mountain top and in a nearby valley, but the absolute temperatures will be quite different at the two locations,” NOAA says. “The use of anomalies in this case will show that temperatures for both locations were below average.”
According to a May 2024 report from the Yale School of Environment, the world experienced an average of 26 more days of extreme heat over the preceding 12 months that would probably not have occurred without climate change (archived here).
The United Nations Intergovernmental Panel on Climate Change says global temperature is expected to reach or exceed 1.5C of warming on average over the next 20 years (archived here).
More of AFP’s reporting on climate misinformation is available here.